Interactive Lab
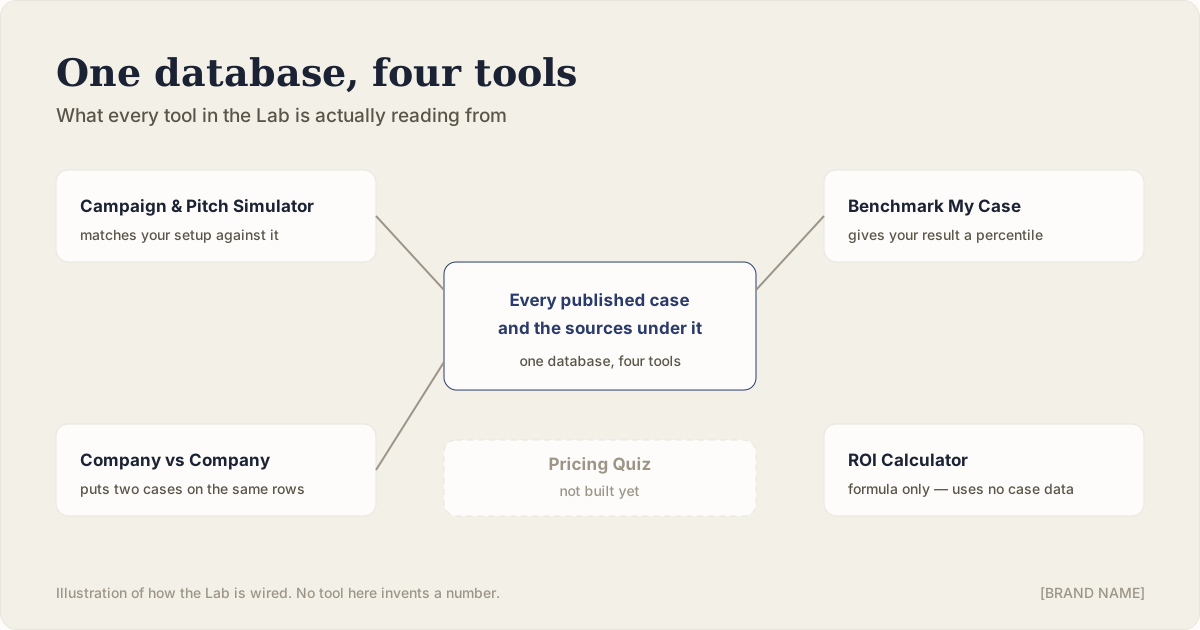
Four tools built on one thing: the real, sourced outcomes of every case we have published. Nothing here invents a number. When the matching data is thin, the tool says so instead of guessing.
Campaign & Pitch Simulator
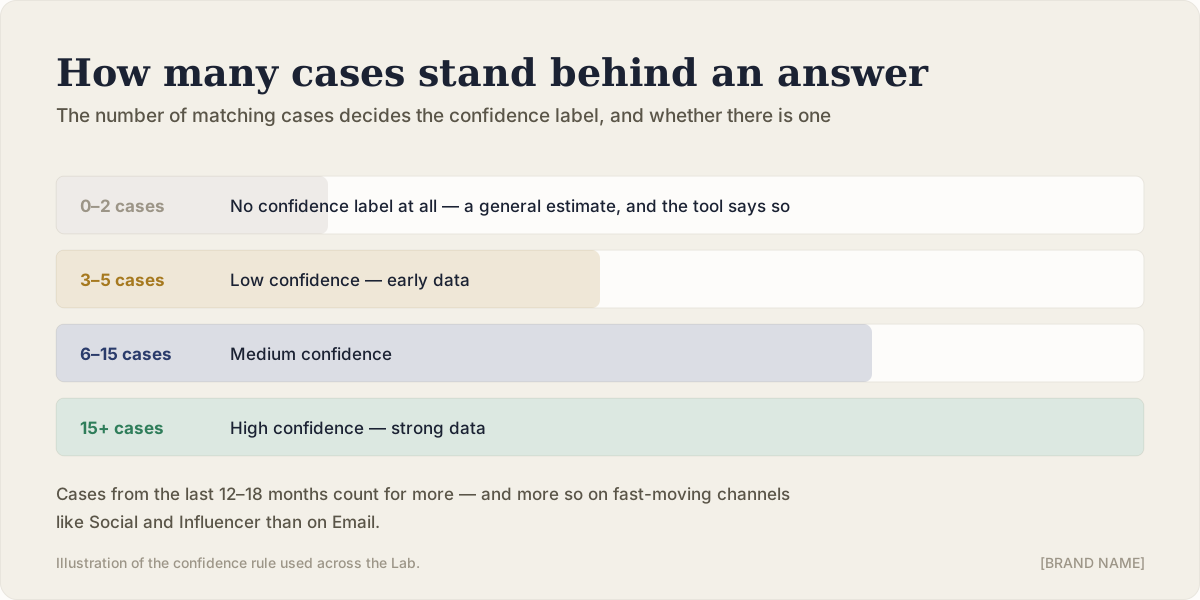
Budget, up to three channels, one strategy. Three steps, then the ROI range and risk level that comparable real campaigns actually produced — with a confidence label that drops to “not enough data yet” below three matching cases.
Open the simulatorROI Calculator
One screen, live as you type. Investment, revenue or savings generated, time period — out comes the ROI percentage and a payback estimate.
Invalid inputs get a plain-language error, never a broken result.
Benchmark My Case
Put in your own budget, channel and the ROI you actually achieved. We compare it against the same case database the Simulator uses and give you a percentile.
Same cold-start rule: below the minimum case count, no percentile is shown.
Company vs Company
Pick any two published companies and put their real revenue and marketing spend side by side, year by year, sourced from their own filings.
Pricing Quiz
A guided walk through the pricing decisions the cases in our archive got right and wrong. Not built yet — the layout is here so it has somewhere to land.
How the confidence label works
No confidence label at all. The tool says it does not have enough matching cases and gives a general estimate.
Low confidence — early data.
Medium confidence.
High confidence — strong data.
Cases from the last 12–18 months are weighted more heavily, and more so for fast-moving channels like Social and Influencer than for Email.