Stitch Fix cut advertising 41% and revenue fell harder
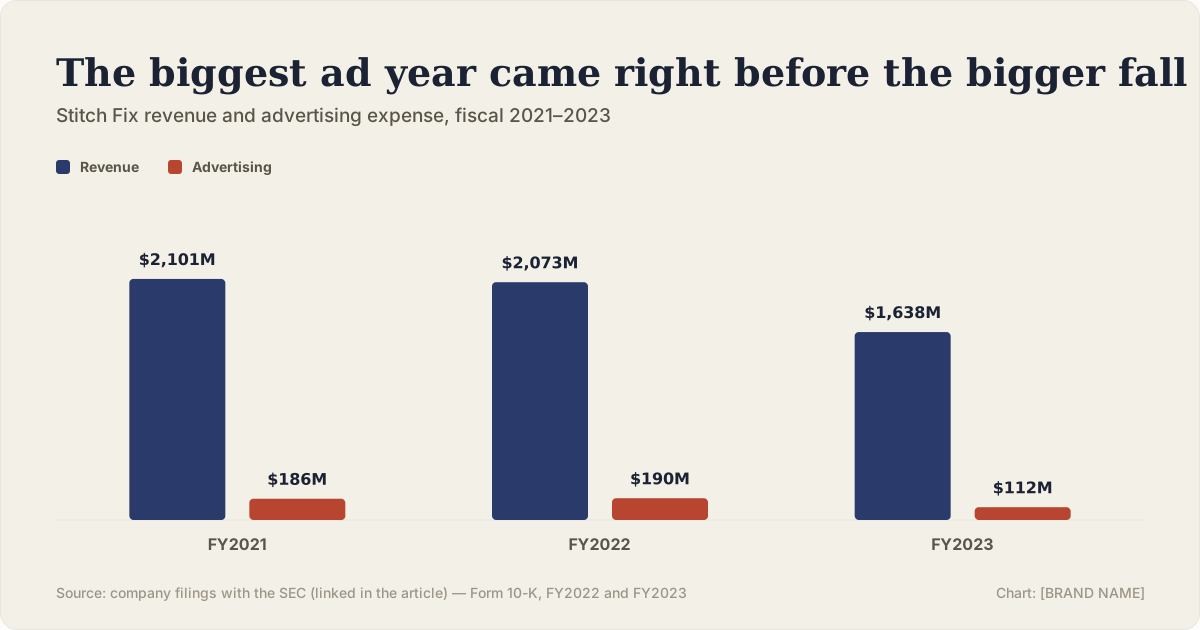
Stitch Fix raised advertising spend in fiscal 2022, a year revenue had already dipped. The following year it cut advertising 41% — and revenue fell 20.9%, its steepest single-year drop. The filings show the sequence, not the cause.

One vote per reader. You can change it. No account needed.
What the filings actually show
Advertising expense is a single audited line in Stitch Fix's 10-K. Stitch Fix's fiscal year ends in late July or early August, so "FY2023" below covers roughly August 2022 through July 2023.
| Fiscal year | Revenue | Advertising | Advertising as % of revenue |
|---|---|---|---|
| FY2021 | $2,101.3M | $185.5M | 8.8% |
| FY2022 | $2,072.8M | $189.9M | 9.2% |
| FY2023 | $1,638.4M | $111.6M | 6.8% |
FY2022 is the year to notice first: revenue had already turned down 1.4% from FY2021, and advertising still went up $4.4M. The advertising ratio rose from 8.8% to 9.2% of revenue in the same year revenue shrank — spending a larger share of a smaller number.
The part that matters is fiscal 2023
In FY2023, Stitch Fix cut advertising by $78.3M, or 41.2% — one of the sharpest single-year marketing cuts of any case published on this site. Revenue fell 20.9% in the same year, its steepest drop across the three years shown here.
Read narrowly, that is two facts, not one causal story: the company spent less on advertising, and revenue fell more than it had in the two prior years. Whether the smaller ad budget caused the bigger decline, or whether Stitch Fix was already losing active clients for reasons unrelated to advertising and simply stopped funding acquisition it could not afford, is not something a single income-statement line can settle.
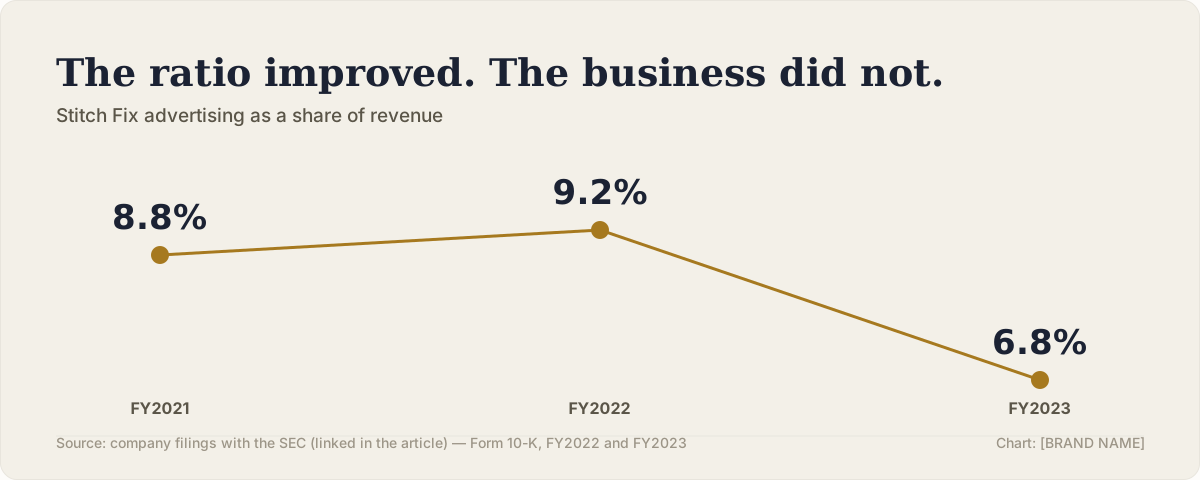
Taken alone, a falling advertising-to-revenue ratio usually reads as good news — spending a smaller share to get the same or more. Here it happened alongside the worst revenue year in the window, which is exactly why the ratio by itself is not enough to judge the decision.
What a cut like this is really testing
A marketing cut made after revenue has already turned down is a different experiment from a cut made from strength. It tests whether the remaining spend was still buying incremental customers, at a moment when the company may have had little choice but to find out — Stitch Fix's own filings describe the FY2023 reduction as part of a deliberate move toward profitability as active client counts continued to decline.
That context matters. A company cutting spend because it is already shrinking is not running a clean test of marketing effectiveness; it is managing a decline. The result — a bigger revenue drop — is consistent with either a marketing cut that mattered, or a business already losing customers for other reasons that also happened to cut its ad budget that year.
What this does not prove
It does not prove that Stitch Fix's advertising was ineffective, and it does not prove the opposite either. Unlike some of the cleaner cases published here, this one has two plausible readings that point in different directions, and the filings alone cannot say which is right.
It also does not transfer neatly to a healthy, growing business. Stitch Fix's active client base was already declining before this cut; a company cutting marketing from a position of growth would be running a genuinely different test.
Three things to take from it
1. A rising ratio in a down year is an early warning, not a footnote. FY2022's small ratio increase, in a year revenue was already falling, was visible a full year before the bigger FY2023 decline.
2. Cutting spend during a decline is not the same experiment as cutting it from strength. The result here does not tell you what a similar cut would do to a growing business.
3. One year of data rarely settles the direction of causation. Whether the ad cut deepened the FY2023 decline, or simply accompanied a decline already underway, needs more than a single income statement to answer.
Questions readers asked
Did cutting advertising cause the bigger revenue drop?
The filings do not establish that. Revenue fell 20.9% in the year advertising was cut 41.2%, but active client declines were already underway, and the 10-K describes the cut as part of a deliberate shift toward profitability rather than an isolated experiment.
How much did advertising fall in dollar terms?
From $189.9M in FY2022 to $111.6M in FY2023, a reduction of $78.3M, or 41.2%.
Was FY2022 already a bad year before the ad cut?
Yes. Revenue fell 1.4% in FY2022 to $2,072.8M even as advertising spend rose to $189.9M — the company spent more in a year revenue had already turned down.
Did the lower advertising ratio in FY2023 mean marketing got more efficient?
Not necessarily. The ratio fell from 9.2% to 6.8% of revenue, but revenue itself fell 20.9% in the same year — a smaller ratio on a shrinking base is not the same achievement as a smaller ratio on a growing one.
This analysis is based on publicly available filings and reporting, all linked above. It represents our editorial interpretation of those sources. We have no affiliation with, and receive no payment from, any company named in this piece. If you believe a figure here is wrong, tell us — corrections are made publicly and the article is marked as updated.
Put your budget and channels into the simulator and see the range published cases landed in.