Warby Parker grew 29% while its marketing share came down
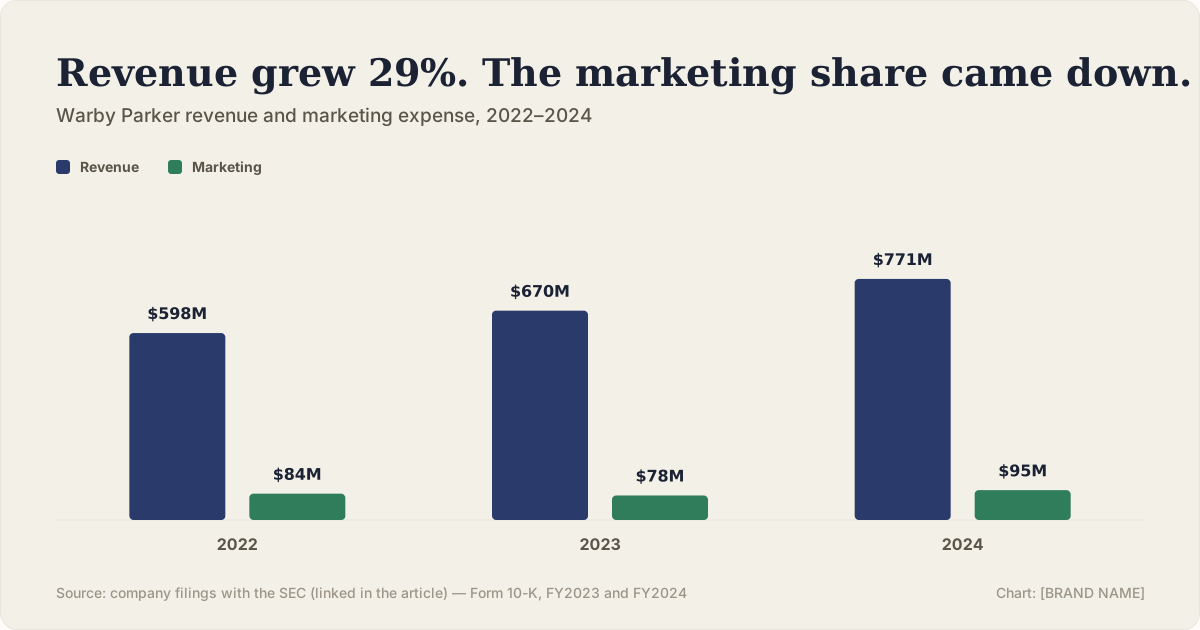
Revenue rose from $598.1M to $771.3M between 2022 and 2024. Marketing spend rose too, but slower — the marketing-to-revenue ratio ended the window at 12.4%, below where it started. One of the tidier cases published here.

One vote per reader. You can change it. No account needed.
What the filings actually show
Marketing expense is a single audited line in Warby Parker's 10-K, reported alongside revenue every year since the company's 2021 direct listing. The three years below are the most recent full fiscal years on file.
| Year | Revenue | Marketing | Marketing as % of revenue |
|---|---|---|---|
| 2022 | $598.1M | $84.2M | 14.1% |
| 2023 | $669.8M | $78.4M | 11.7% |
| 2024 | $771.3M | $95.5M | 12.4% |
Revenue grew every year. Marketing spend did not — it dropped 6.9% in 2023 even as revenue grew 12.0%, then rose again 21.8% in 2024 as revenue grew a further 15.2%. Across the full two-year window, revenue grew 29.0% and marketing grew 13.4%.
The part that matters is the ratio, not any single year
Looked at year to year, the marketing line moves around: down in 2023, sharply up in 2024. Looked at as a share of revenue, the picture is steadier — 14.1% in 2022, easing to 11.7% in 2023, and settling at 12.4% in 2024, still below where the window started.
2024's marketing spend, $95.5M, is the largest dollar figure of the three years. That is worth noting precisely because a reader skimming only the dollar totals could mistake rising spend for rising inefficiency. The ratio says otherwise: revenue grew faster than marketing did, even in the year marketing spend itself hit a new high.
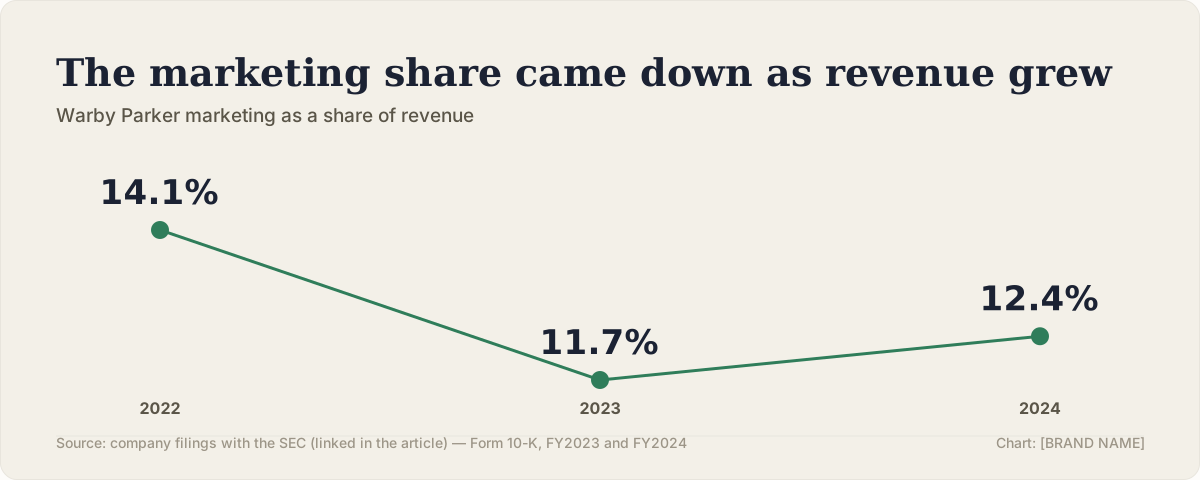
This is the shape a marketing budget scaling sensibly with growth is supposed to produce: spend that moves with the business rather than ahead of it, without needing a crisis-driven cut to get there.
What a falling ratio is really testing
A marketing ratio that eases while revenue keeps growing suggests that newer stores, repeat purchases, or word of mouth are doing more of the work that paid acquisition used to carry alone — the kind of maturing unit economics a retailer's investors look for. It does not, by itself, prove that every marketing dollar spent was well targeted; it is consistent with that story, but so is a period of unusually strong non-marketing demand that happened to coincide with steady spend.
What the filings do support is the comparison that matters for this site's purpose: unlike the cases where marketing rose faster than revenue, here revenue outpaced marketing on average across the window, in a period when the company was expanding its store footprint and, per its own filings, focusing on profitability alongside growth.
What this does not prove
It does not prove Warby Parker's marketing strategy is optimal, and it does not transfer automatically to a company earlier in its growth curve, where a rising marketing ratio can be the correct choice to build initial brand awareness. It also does not mean every quarter inside these years looked this tidy — the 21.8% single-year jump in 2024 marketing spend is a real swing that a reader relying only on the three-year average would miss.
It also is not evidence about profitability. This piece tracks revenue against marketing spend only; net income, store-opening costs and other lines are not covered here.
Three things to take from it
1. Judge the ratio across years, not one year at a time. 2024's marketing spend was the highest of the three years and would look alarming in isolation — reading it against revenue growth in the same year changes the picture.
2. A ratio that eases is worth naming when it happens, the same way a rising one is. Most of the cases on this site show marketing outrunning revenue; this is the other direction, and it deserves the same scrutiny in both cases.
3. One good three-year window is not a permanent trend. Whether the ratio keeps easing, flattens, or reverses in the next filing is the honest next question, not something this piece can answer yet.
Questions readers asked
Did Warby Parker cut its marketing budget?
Only in 2023, when it fell 6.9% to $78.4M. In 2024 it rose 21.8% to $95.5M, the highest dollar figure of the three years shown. It is the ratio to revenue, not the dollar figure, that ended the window lower than it started.
How much did revenue grow across the period?
From $598.1M in 2022 to $771.3M in 2024, a 29.0% increase over two years.
Is this the same pattern as the site's other "good" cases, like Dropbox?
Similar in spirit — revenue outpacing a cost line — but Dropbox's case tracks gross margin, not marketing spend. This is the first case on the site where marketing spend itself, against revenue, moved in the company's favor over the full window.
Does a falling marketing ratio always mean better efficiency?
Not automatically. It is consistent with more efficient marketing, but also with unusually strong demand from other sources during the period. The filings show the ratio moved favorably; they do not isolate the cause.
This analysis is based on publicly available filings and reporting, all linked above. It represents our editorial interpretation of those sources. We have no affiliation with, and receive no payment from, any company named in this piece. If you believe a figure here is wrong, tell us — corrections are made publicly and the article is marked as updated.
Put your budget and channels into the simulator and see the range published cases landed in.