DocuSign's marketing cost per revenue dollar fell three years running
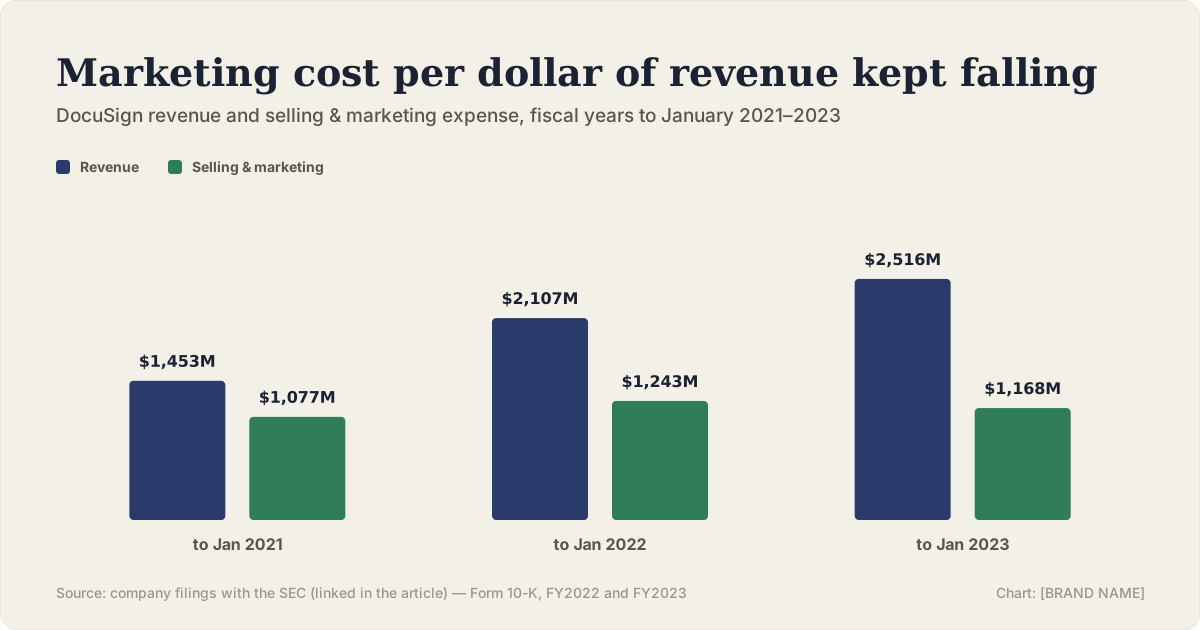
In the fiscal year covering the pandemic remote-work surge, DocuSign spent 74 cents on selling and marketing for every dollar of revenue. Two fiscal years later it spent 46 cents. Revenue grew 73% across the same window.


One vote per reader. You can change it. No account needed.
What the filings actually show
Selling and marketing expense is a single audited line in DocuSign's 10-K. DocuSign's fiscal year ends January 31, so "fiscal year to January 2021" below covers roughly February 2020 through January 2021 — the period that captured the sharpest part of the pandemic-driven shift to remote signing.
| Fiscal year | Revenue | Selling & marketing | Cost per revenue dollar |
|---|---|---|---|
| to Jan 2021 | $1,453.0M | $1,076.5M | 74.1¢ |
| to Jan 2022 | $2,107.2M | $1,242.7M | 59.0¢ |
| to Jan 2023 | $2,515.9M | $1,168.1M | 46.4¢ |
Revenue grew 45.0% in the fiscal year to January 2022, then a further 19.4% in the year to January 2023. Selling and marketing spend grew 15.4% in the first of those years, then fell 6.0% in the second — meaning the cost-per-dollar ratio improved even in the year revenue growth itself slowed.
Unlike Zoom, the improvement held for a third year
This site has already published a similar pandemic-software case: Zoom's marketing cost per revenue dollar fell from 54.7 cents to 25.8 cents in its pandemic surge year, then rose back to 27.7 cents the year after — an improvement that partly reversed once the windfall year passed.
DocuSign's pattern is different. Its ratio started at 74.1 cents — already higher than Zoom's post-surge figure — and kept falling in both subsequent years, to 59.0 cents and then 46.4 cents. There was no reversal year in this window.
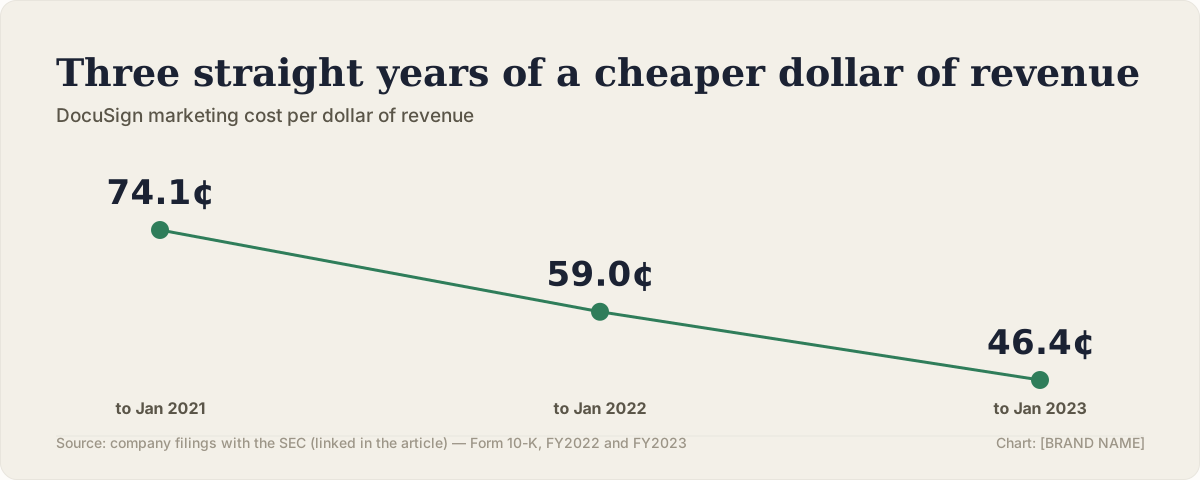
The distinction matters for how much weight to put on either case. A one-year improvement that reverses, like Zoom's, is consistent with a temporary demand spike flattering the ratio. Three consecutive years of improvement, spanning the peak and its aftermath, is harder to explain by a single windfall year alone.
What three years of improvement is really testing
A marketing ratio that keeps improving after the initial demand surge has passed suggests the company built durable channels — direct sign-ups, renewals, word of mouth among existing customers — that needed less paid support to sustain growth than the acquisition-heavy early period did. That is a stronger claim than "the pandemic helped," because the improvement continued in the two years after the pandemic tailwind was easing.
It does not, on its own, separate how much of the continued improvement came from marketing efficiency specifically versus e-signature software becoming a more established, less novel purchase that required less market education to sell.
What this does not prove
It does not prove DocuSign's marketing organization is better run than Zoom's, or than any other company on this site — different products, categories and competitive dynamics make direct comparisons unreliable. It also does not extend past the fiscal year to January 2023; whether the ratio kept falling, flattened, or reversed afterward is a question for a later filing, not this one.
It is also limited to the selling-and-marketing line specifically. It says nothing about overall profitability, which depends on cost of revenue, research and development, and administrative costs as well.
Three things to take from it
1. Check whether an efficiency gain survives the year after the windfall. The single most useful thing this case adds to the Zoom comparison already on this site is the third data point — the one that shows whether an improvement holds or reverses.
2. A high starting ratio is not disqualifying. DocuSign's 74.1-cent starting point was higher than Zoom's ending point, and it still improved from there for two more years.
3. Category maturity can explain part of a trend that looks like pure marketing skill. As a product category becomes more familiar, less of the marketing budget needs to go toward basic education, which can improve the ratio independent of any change in marketing quality.
Questions readers asked
Is this the same story as the site's Zoom case?
Similar setup — a pandemic-era software company's marketing cost per revenue dollar — but a different result. Zoom's ratio improved once and then partly reversed; DocuSign's kept improving for three straight fiscal years in this window.
How much did revenue grow across the three years?
From $1,453.0M (fiscal year to January 2021) to $2,515.9M (fiscal year to January 2023), a 73.1% increase.
Did marketing spend fall in dollar terms too, not just as a ratio?
Yes, in the final year of the window. Selling and marketing expense rose from $1,076.5M to $1,242.7M between the first two fiscal years, then fell to $1,168.1M in the third — a 6.0% dollar decline even as revenue kept growing.
Does a falling cost-per-dollar ratio mean marketing quality improved?
It is consistent with that, but the filings do not isolate marketing quality from other explanations, including the product category becoming more familiar to buyers and needing less education-heavy spend over time.
This analysis is based on publicly available filings and reporting, all linked above. It represents our editorial interpretation of those sources. We have no affiliation with, and receive no payment from, any company named in this piece. If you believe a figure here is wrong, tell us — corrections are made publicly and the article is marked as updated.
Put your budget and channels into the simulator and see the range published cases landed in.