Meta cut marketing spend and headcount together, then revenue came back
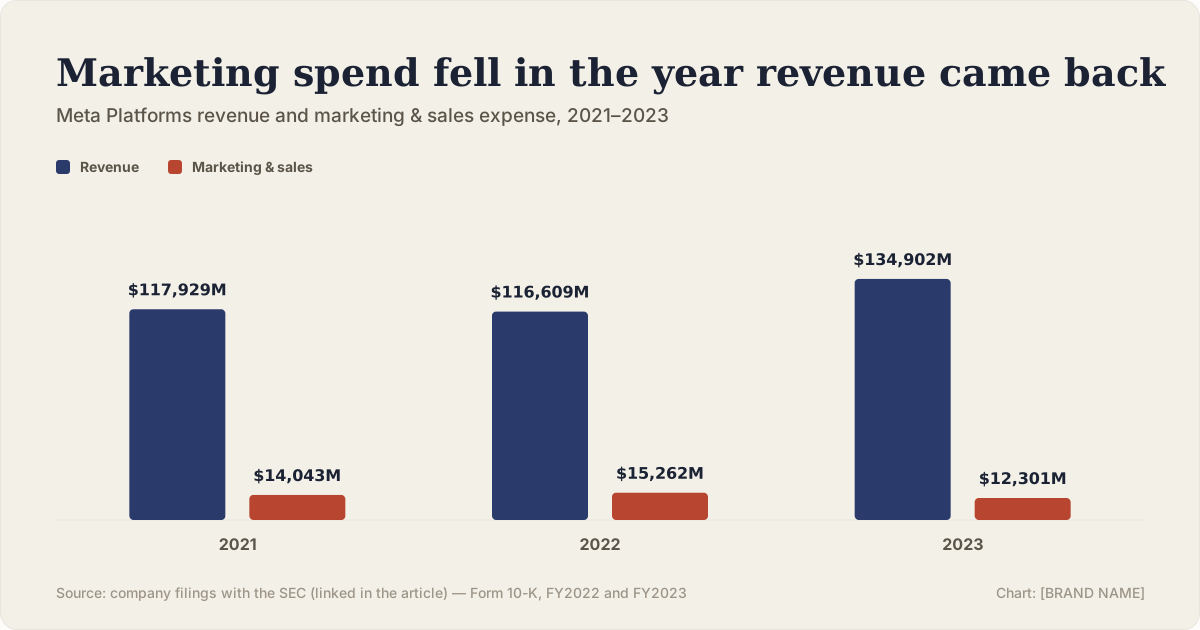
Meta's marketing and sales expense fell 19.4% in 2023, the same year global headcount fell to 67,317 from a 2021 peak of 71,970. Revenue, which had fallen for the first time in company history the year before, grew 15.7%.


One vote per reader. You can change it. No account needed.
What the filings actually show
Marketing and sales expense is a single audited line in Meta's 10-K, reported as "Marketing and sales" alongside cost of revenue, research and development, and general and administrative expense. The figures below span the year of Meta's first-ever annual revenue decline and the year after.
| Year | Revenue | Marketing & sales | Marketing as % of revenue |
|---|---|---|---|
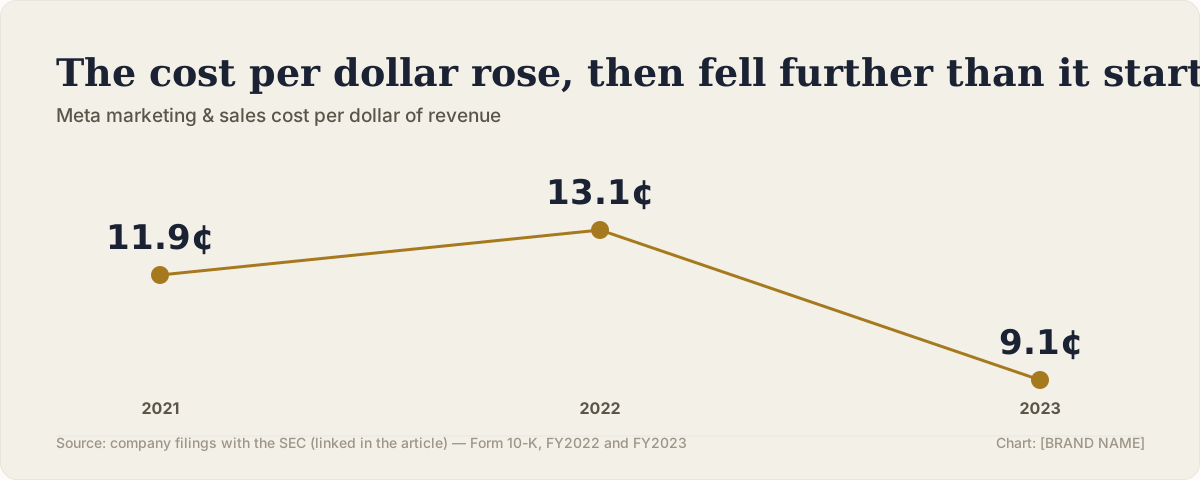
| 2021 | $117,929M | $14,043M | 11.9% |
| 2022 | $116,609M | $15,262M | 13.1% |
| 2023 | $134,902M | $12,301M | 9.1% |
2022 is the year to notice first: revenue fell 1.1% — the only annual decline in Meta's history as a public company — and marketing and sales spend rose 8.7% in the same twelve months. The ratio moved from 11.9% to 13.1% of revenue, spending more of a smaller number.
The headcount side of the same story
Meta's 10-K "Human Capital" section reports a global workforce of 71,970 employees as of December 31, 2021. Starting in November 2022, the company announced a layoff of approximately 11,000 employees — about 13% of its workforce at the time — as part of what it described publicly as cost-reduction efforts that also included scaling back budgets, reducing perks and shrinking its real-estate footprint. By December 31, 2023, Meta reported a global workforce of 67,317 — a net decline of 4,653 employees, or 6.5%, from the 2021 peak.
A second, widely reported round of roughly 10,000 further job cuts was announced in March 2023. That figure comes from Meta's public statements at the time rather than being separately restated with a specific number in the fiscal 2023 10-K text itself — see the sourcing note below.
Net headcount fell by a smaller percentage (6.5%) than the widely reported scale of the layoffs alone would suggest, because Meta continued hiring in some areas — reportedly including AI and infrastructure roles — even while cutting elsewhere. The filings support the start and end points precisely; they do not provide a single reconciling number for hiring versus departures in between.
What cutting both at once is really testing
Cutting marketing spend and headcount in the same period tests whether a company had accumulated capacity — in people and in paid programs — beyond what its revenue could support. Meta's own framing of this period as a "Year of Efficiency" makes that intent explicit rather than something this piece is inferring from the numbers alone.
The 2023 results are consistent with that bet paying off: revenue grew 15.7% on a marketing and sales budget 19.4% smaller than the year before, and on a workforce smaller than its 2021 peak. What the filings cannot show is how much of the 2023 revenue recovery came from the cost discipline itself, versus a broader recovery in digital advertising demand and the advertising industry overall that would have helped regardless of Meta's own spending choices.
What this does not prove
It does not prove that cutting marketing and sales spend caused the revenue recovery, or that the layoffs specifically improved marketing performance rather than simply reducing cost. Digital advertising demand broadly recovered industry-wide in 2023 after a soft 2022, and Meta's results likely reflect some of that same tailwind independent of its own cost decisions.
It also does not mean the cuts were costless. Reducing headcount by thousands of people, twice in five months, has consequences for institutional knowledge, morale and execution speed that do not show up in a revenue or expense line, and this piece — built from the financial filings — cannot measure them.
Three things to take from it
1. A rising marketing ratio in a down revenue year is a signal worth naming immediately. 2022's ratio increase, in the year revenue first fell, was visible in that year's filing — a full year before the larger cuts followed.
2. Net headcount change understates the scale of a layoff when hiring continues elsewhere. Meta's 6.5% net headcount decline sits well below the ~13% single round of cuts reported for November 2022 alone, because other hiring continued in parallel.
3. A recovery in the same year as a cost cut is not proof the cut caused it. Broader industry conditions moved in Meta's favor in 2023 too, and the filings alone cannot separate how much of the rebound belongs to each cause.
Questions readers asked
Did the marketing cuts and layoffs cause the 2023 revenue recovery?
The filings do not establish that. Revenue grew 15.7% in the same year marketing and sales spend fell 19.4% and headcount was below its 2021 peak, but industry-wide digital advertising demand also recovered in 2023, which likely contributed independent of Meta's own cost decisions.
How many people did Meta actually lay off?
The fiscal 2022 10-K states a November 2022 layoff of approximately 11,000 employees. A second round of roughly 10,000 further cuts was publicly announced in March 2023, but is not separately restated with a specific figure in the fiscal 2023 10-K text — see the sourcing note for this distinction.
Why did net headcount only fall 6.5% if roughly 21,000 people were laid off across two rounds?
Because Meta continued hiring in some areas throughout the same period. The 71,970-to-67,317 net change reflects departures and new hires together; the filings do not provide a single number isolating gross layoffs from gross hiring in this window.
Did marketing spend fall every year in this window?
No. It rose from $14,043M in 2021 to $15,262M in 2022, then fell to $12,301M in 2023 — a 19.4% cut from the 2022 level, and 12.4% below where the window started.
Where sources disagree: A second layoff round of roughly 10,000 employees, announced by Meta in March 2023 and widely reported at the time, is not restated with a specific headcount figure in the fiscal 2023 10-K's Human Capital section — that filing gives only the year-end total of 67,317. We have used the 10-K's own start and end headcount figures as the primary numbers throughout, and are noting the March 2023 round as company-announcement-sourced context rather than presenting it as an equally primary figure.
This analysis is based on publicly available filings and reporting, all linked above. It represents our editorial interpretation of those sources. We have no affiliation with, and receive no payment from, any company named in this piece. If you believe a figure here is wrong, tell us — corrections are made publicly and the article is marked as updated.
Put your budget and channels into the simulator and see the range published cases landed in.